Marketing Research Homework Write-Up Utilizing SPSS
- Maggie Rennie
- Mar 9, 2022
- 4 min read
Independent Samples T-Test: The research involves a few survey questions from the “Jeans Survey” dataset. The first research hypothesis is looking for a gender difference in perceptions of importance of online reviews. The second hypothesis is looking for gender differences in the number of jeans owned.
The data file has three variables of interest. The variable view includes the coding values for the variables of interest
First, the grouping variable labeled “Q11gender” has two values, Female = 1 and Male = 2.
The second variable labeled “Q10 ImpReviews” asks the respondents “Please indicate the level of importance for online reviews or comments in deciding which brand of jeans to purchase” on a scale from 1=Very Unimportant to 7=Very Important.
The third variable labeled “Q5 Number of jeans own” asked “How many pairs of jeans do you currently own?”.
Compute two independent samples t-tests to see if gender influences the two variables. Please answer the questions below.
Independent Samples T-Test #1: Variable “Q10 Importance-Online Reviews or Comments”
1. What is the independent variable in this test? Gender
2. What is the dependent variable in this test? Importance Placed on Online Reviews for Jeans
3. Include a means table and the t-test results table. Include a label and descriptive title for each table.
Table 1: Statistics for Gender and The Importance for Online Reviews/Comments

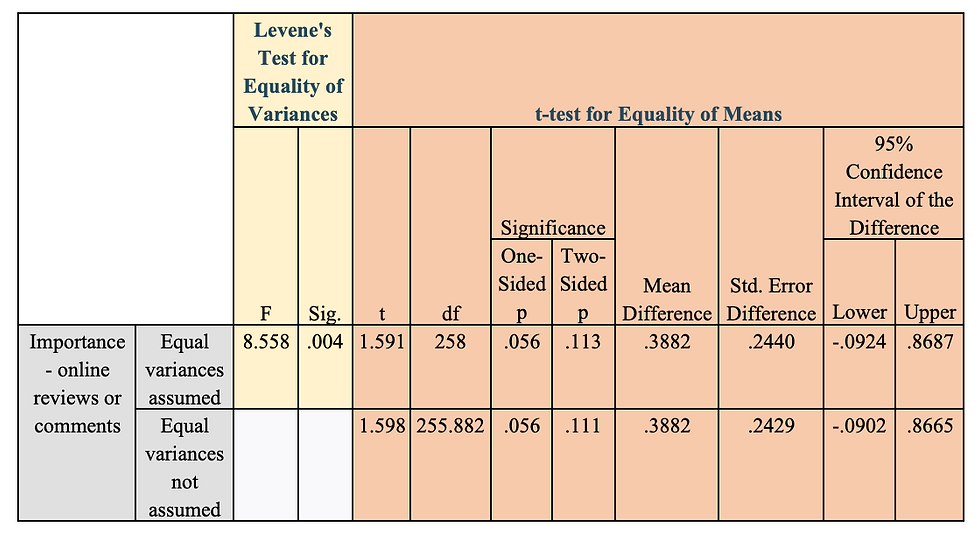
Table 2: Levene’s Test and T-Test for Gender and The Importance for Online Reviews/Comments

4. Report and interpret the Levene’s results
I ran a Levene’s test to see if the supplied data meets the assumptions of equal variances. As seen in Table 2, the data presents an f-value of 8.558 and a p-value of .004. Because the p-value of .004 is less than .05, it is evident that we have a significant Levene’s Test. Because it is significant, we would reject the null hypothesis. In conclusion, according to the data in Table 2- we have not met the assumptions of equal variances for comparing gender and the importance of online reviews or comments.
5. Write a complete results section based on your analysis (this should include an overall introduction
I first ran a Levene’s test to see if the supplied data meets the assumptions of equal variances. As seen in Table 2, the data presents an f-value of 8.558 and a p-value of .004. Because the p-value of .004 is less than .05, it is evident that we have a significant Levene’s Test. Because it is significant, we would reject the null hypothesis. In conclusion, according to the data in Table 2- we have not met the assumptions of equal variances for comparing gender and the importance of online reviews or comments. Also in Table 2, I found the t-value to be 1.598 and its corresponding p-value to be .111. Because .111 is greater than .05, the t-test is proven not significant. The means compared in Table 1 show that females have a mean of 4.261 and males have a mean of 3.873. According to the t-test results, these means are not statistically different as seen by a p-value of .111. The hypothesis is not supported by these results because according to the mean results in Table 1 and the t-test results in Table 2, there is not a statistical difference between genders on whether or not they place importance on online reviews on jeans.
Independent Samples T-Test #2: Variable “Q5 Number of Jeans Owned”
1. What is the independent variable in this test? Gender
2. What is the dependent variable in this test? Number of Jeans Owned
3. Include a means table and the t-test results table. Include a label and descriptive title for each table.
Table 3: Statistics for Gender and The Number of Jeans Owned

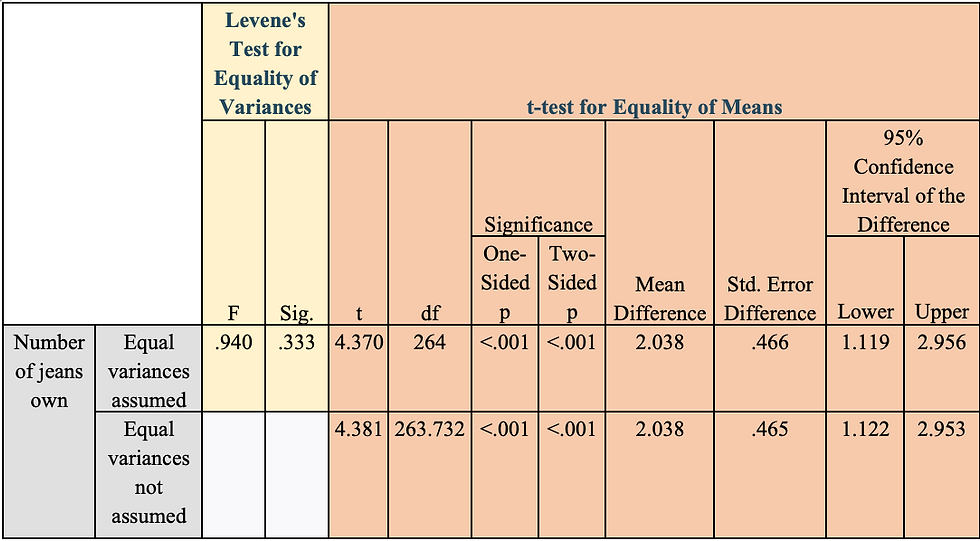
Table 4: Levene’s Test and T-Test for Gender and The Number of Jeans Owned

4. Report and interpret the Levene’s results
I ran a Levene’s test to see if the supplied data meets the assumptions of equal variances. According to Table 4, we have an f-value of .940 and a p-value of .333. Because the p-value of .333 is greater than .05, it is evident that we do not have a significant Levene’s Test. Since we do not have a significant test, we would fail to reject the null. In conclusion, the data shown in Table 4 shows us that we have met the assumption of equal variances.
5. Write a complete results section based on your analysis (this should include an overall introduction
I first ran a Levene’s test to see if the supplied data meets the assumptions of equal variances. According to Table 4, we have an f-value of .940 and a p-value of .333. Because the p-value of .333 is greater than .05, it is evident that we do not have a significant Levene’s Test. Since we do not have a significant test, we would fail to reject the null. In conclusion, the data shown in Table 4 shows us that we have met the assumption of equal variances. Table 4 shows that there is a t-value of 4.370 and its corresponding p-value of .000. Because .000 is less than .05, the results from the t-test prove to be significant. Table 3 tells us that the mean number for jeans owned by females and males is 8.77 and 6.73 respectively. According to the t-test results in Table 4, these means are statistically different as shown by the p-value of .000. The hypothesis is then supported by these results because it was hoping to find a statistical difference between gender and the average number of jeans owned by each gender.


Comments